Mark Zuckerberg unveils Facebook's new Coronavirus tracking site
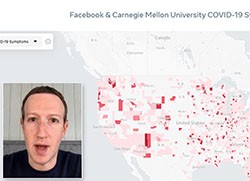 The CEO of Facebook revealed a new coronavirus map powered by user data, aiming to help track the spread of the global pandemic. The map was developed by researchers at Carnegie Mellon University, based on Facebook surveys by Google and Facebook users aimed at self-reporting COVID-19 symptoms.
The researchers combined the responses with medical testing and claimed to provide a more comprehensive view of the pandemic with faster rates. Within the next weeks, they are hoping to use the data to provide forecasts to hospitals, with first responders and officials anticipating the ICU hospitalizations related to COVID-19.
The first map was released on Monday, based on over two million responses from US users in a ten-day trial period. Zuckerberg mentioned that researchers are planning on expanding the COVIDcast project for a worldwide release with the assistance of the University of Maryland. Users across the globe should see a popup on their Facebook profile with a link leading to the survey, ones that include COVID-19 symptoms such as shortness of breath, loss of smell, cough, and fever.
It is critical to have a clear understanding of the spread
Zuckerberg shared with the Washington Post that he believes it is critical to have a clear understanding of the spread of this disease so countries can develop plans to reopen their societies again. With the billions of people online, Facebook may help researchers and health authorities get the information they need to respond to the outbreak and to plan for recovery, the CEO added. Zuckerberg discussed the results of the surveys in an interview for ABC News, saying that in just ten days, the data managed to provide a 'strikingly accurate description of US hotspots.'
He also mentioned ski resorts might have been playing an early role in the spread of the contagion, according to the data. The maps coming from some counties around the US were showing that ski resorts were showing people with symptoms.
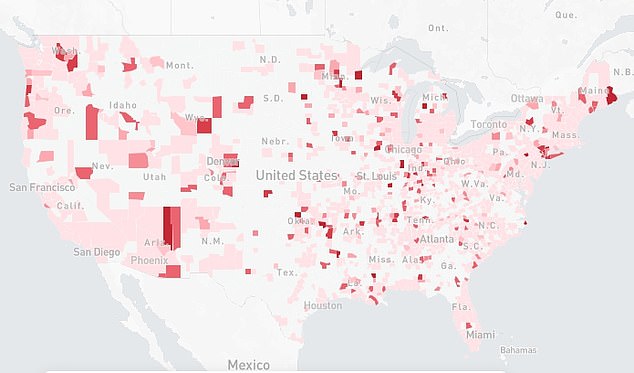
The live map, posted below, shows color codes for each county based on the percentage of people self-reporting symptoms, ranging from light pink for 0% to dark pink for up to 2.4%. Higher symptom rates were seen in Summit County in Colorado and Blaine County in Idaho. Other areas that saw high rates of reported symptoms included Navajo County in Arizona, with a large outbreak in the Navajo Nation, as well as counties surrounding New York City.
Zuckerberg is confident that researchers can create an accurate data set.
He believes the work done by Carnegie Mellon is extensive, so the data is of high quality and correlating with the data on the ground seen by hospitals. He looked forward to dispelling privacy concerns people have with submitting answers about their health on social media platforms by saying the information responses don't go to Facebook.
Carnegie Mellon produces an aggregate report that doesn't include individual responses by users, as the survey belongs to the university and not Facebook, Zuckerberg added. Another benefit of the survey is the increase of transparency of outbreak reporting worldwide since people have concerns countries may be withholding information about the extent of the pandemic.
In an essay for Washington Post, Zuckerberg mentioned that focusing on symptoms is essential due to the challenges the federal government is facing with testing. Experiencing symptoms is a sign of becoming more seriously ill. Thus the survey can help forecast the cases seen by hospitals. The CEO believes this will be an indicator of where the outbreak is growing. Researchers from Carnegie Mellon said they see about a million responses weekly from Facebook users and about 600 thousand from Google users.
Ryan Tibshirani, the co-leader of the Delphi COVID-19 Response team at Carnegie Mellon, said they are very happy with the Google and Facebook survey results. The survey results were combined with data from other sources, providing real-time indications of COVID-19 activity unseen by other sources, according to the team. The CMU researchers will monitor the changes over time, allowing them to forecast the pandemic's activity for weeks ahead. The information of the surveys is kept anonymous and will be made publically available on the COVIDcast website at CMU and the Facebook map site.